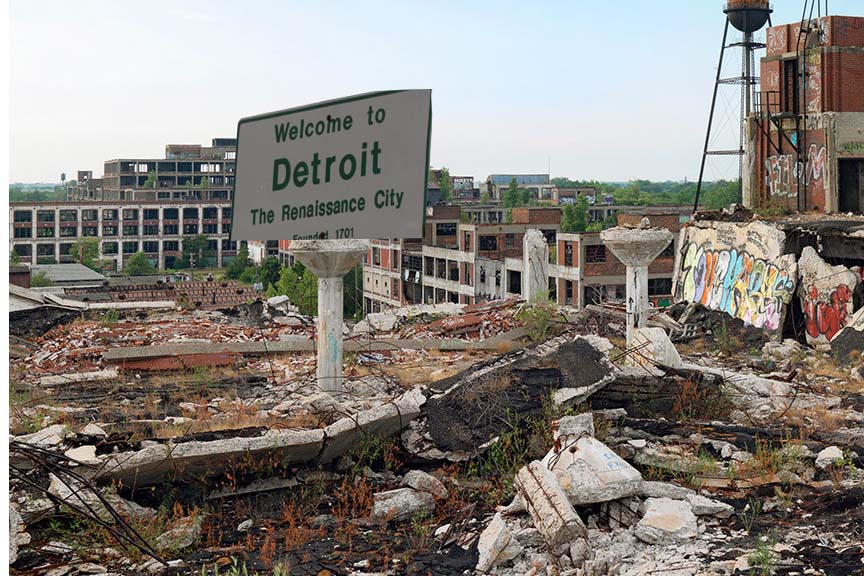
DETROIT
Population vs representation
Year
1940 - 1950 1,623,452 - 1,849,568 +13.9% Republican
1950 - 1960 1,849,568 - 1,670,144 -9.7% Democrat
1960 - 1970 1,670,144 - 1,514,063 -9.3% Democrat
1970 - 1980 1,514,063 - 1,203,368 -20.5% Democrat
1980 - 1990 1,203,368 - 1,027,974 -14.6% Democrat
1990 - 2000 1,027,974 - 951,270 -7.5% Democrat
2022 630,000 Democrat
Today there is not one grocery store or Starbucks within the city limits, 62 years of Social planning and counting. Next stop Chicago and California.